


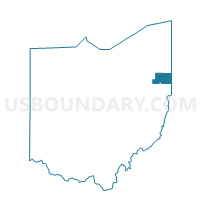
Census Tract 8109, Mahoning County, Ohio
About
Outline

Summary
| Unique Area Identifier | 484004 |
| Name | Census Tract 8109 |
| County | Mahoning County |
| State | Ohio |
| Area (square miles) | 16.41 |
| Land Area (square miles) | 16.31 |
| Water Area (square miles) | 0.11 |
| % of Land Area | 99.36 |
| % of Water Area | 0.64 |
| Latitude of the Internal Point | 41.08678610 |
| Longtitude of the Internal Point | -80.53854470 |
| Total Population | 2,244 |
| Total Housing Units | 1,014 |
| Total Households | 909 |
| Median Age | 48.5 |
Maps

Graphs
Select a template below for downloading or customizing gragh for Census Tract 8109, Mahoning County, Ohio


Neighbors
Neighoring Census Tract (by Name) Neighboring Census Tract on the Map
- Census Tract 104, Lawrence County, PA
- Census Tract 105, Lawrence County, PA
- Census Tract 327.01, Mercer County, PA
- Census Tract 8101, Mahoning County, OH
- Census Tract 8103, Mahoning County, OH
- Census Tract 8108, Mahoning County, OH
- Census Tract 8110.01, Mahoning County, OH
- Census Tract 8111, Mahoning County, OH
- Census Tract 8138, Mahoning County, OH
- Census Tract 9315, Trumbull County, OH
- Census Tract 9317, Trumbull County, OH
Top 10 Neighboring County Subdivision (by Population) Neighboring County Subdivision on the Map
- Youngstown city, Mahoning County, OH (66,971)
- Poland township, Mahoning County, OH (14,960)
- Hubbard township, Trumbull County, OH (13,528)
- Struthers city, Mahoning County, OH (10,713)
- Campbell city, Mahoning County, OH (8,235)
- Shenango township, Mercer County, PA (3,929)
- Pulaski township, Lawrence County, PA (3,452)
- Mahoning township, Lawrence County, PA (3,083)
- Coitsville township, Mahoning County, OH (1,392)
- Lowellville village, Mahoning County, OH (1,155)
Top 10 Neighboring Place (by Population) Neighboring Place on the Map
- Youngstown city, OH (66,982)
- Struthers city, OH (10,713)
- Campbell city, OH (8,235)
- Lowellville village, OH (1,155)
- New Bedford CDP, PA (925)
- Maplewood Park CDP, OH (280)
Top 10 Neighboring Unified School District (by Population) Neighboring Unified School District on the Map
- Youngstown City School District, OH (69,017)
- Poland Local School District, OH (15,352)
- Hubbard Exempted Village School District, OH (13,576)
- Struthers City School District, OH (11,852)
- Wilmington Area School District, PA (11,828)
- Mohawk Area School District, PA (10,867)
- Campbell City School District, OH (8,220)
- West Middlesex Area School District, PA (7,454)
- Lowellville Local School District, OH (2,126)
Top 10 Neighboring State Legislative District Lower Chamber (by Population) Neighboring State Legislative District Lower Chamber on the Map
- State House District 59, OH (112,255)
- State House District 65, OH (102,284)
- State House District 60, OH (95,158)
- State House District 7, PA (56,775)
- State House District 9, PA (56,261)
Top 10 Neighboring State Legislative District Upper Chamber (by Population) Neighboring State Legislative District Upper Chamber on the Map
- State Senate District 33, OH (323,425)
- State Senate District 32, OH (311,809)
- State Senate District 50, PA (235,966)
- State Senate District 47, PA (225,797)
Top 10 Neighboring 111th Congressional District (by Population) Neighboring 111th Congressional District on the Map
Top 10 Neighboring 5-Digit ZIP Code Tabulation Area (by Population) Neighboring 5-Digit ZIP Code Tabulation Area on the Map
- 44505, OH (19,357)
- 44425, OH (14,898)
- 44471, OH (11,097)
- 44405, OH (8,229)
- 16159, PA (4,706)
- 44436, OH (3,836)
- 16116, PA (3,074)
- 16143, PA (2,901)
- 16140, PA (123)
- 16155, PA (103)
Data
Demographic, Population, Households, and Housing Units
** Data sources from census 2010 **
Show Data on Map
Download Full List as CSV
Download Quick Sheet as CSV
| Subject | This Area | Mahoning County | Ohio | National |
|---|---|---|---|---|
| POPULATION | ||||
| Total Population Map | 2,244 | 238,823 | 11,536,504 | 308,745,538 |
| POPULATION, HISPANIC OR LATINO ORIGIN | ||||
| Not Hispanic or Latino Map | 2,174 | 227,687 | 11,181,830 | 258,267,944 |
| Hispanic or Latino Map | 70 | 11,136 | 354,674 | 50,477,594 |
| POPULATION, RACE | ||||
| White alone Map | 2,125 | 190,848 | 9,539,437 | 223,553,265 |
| Black or African American alone Map | 67 | 37,433 | 1,407,681 | 38,929,319 |
| American Indian and Alaska Native alone Map | 9 | 491 | 25,292 | 2,932,248 |
| Asian alone Map | 4 | 1,682 | 192,233 | 14,674,252 |
| Native Hawaiian and Other Pacific Islander alone Map | 4 | 51 | 4,066 | 540,013 |
| Some Other Race alone Map | 11 | 3,418 | 130,030 | 19,107,368 |
| Two or More Races Map | 24 | 4,900 | 237,765 | 9,009,073 |
| POPULATION, SEX | ||||
| Male Map | 1,176 | 115,500 | 5,632,156 | 151,781,326 |
| Female Map | 1,068 | 123,323 | 5,904,348 | 156,964,212 |
| POPULATION, AGE (18 YEARS) | ||||
| 18 years and over Map | 1,843 | 187,485 | 8,805,753 | 234,564,071 |
| Under 18 years | 401 | 51,338 | 2,730,751 | 74,181,467 |
| POPULATION, AGE | ||||
| Under 5 years | 81 | 12,810 | 720,856 | 20,201,362 |
| 5 to 9 years | 102 | 13,725 | 747,889 | 20,348,657 |
| 10 to 14 years | 118 | 14,983 | 774,699 | 20,677,194 |
| 15 to 17 years | 100 | 9,820 | 487,307 | 12,954,254 |
| 18 and 19 years | 57 | 6,427 | 336,375 | 9,086,089 |
| 20 years | 33 | 2,945 | 163,986 | 4,519,129 |
| 21 years | 28 | 2,766 | 157,045 | 4,354,294 |
| 22 to 24 years | 43 | 8,028 | 442,085 | 12,712,576 |
| 25 to 29 years | 84 | 12,886 | 718,630 | 21,101,849 |
| 30 to 34 years | 81 | 12,959 | 691,329 | 19,962,099 |
| 35 to 39 years | 108 | 13,762 | 718,462 | 20,179,642 |
| 40 to 44 years | 159 | 14,646 | 761,369 | 20,890,964 |
| 45 to 49 years | 185 | 16,985 | 855,134 | 22,708,591 |
| 50 to 54 years | 219 | 19,613 | 887,057 | 22,298,125 |
| 55 to 59 years | 203 | 18,379 | 786,857 | 19,664,805 |
| 60 and 61 years | 102 | 6,672 | 284,403 | 7,113,727 |
| 62 to 64 years | 99 | 8,715 | 381,006 | 9,704,197 |
| 65 and 66 years | 62 | 4,377 | 198,333 | 5,319,902 |
| 67 to 69 years | 90 | 6,599 | 280,531 | 7,115,361 |
| 70 to 74 years | 94 | 8,955 | 371,370 | 9,278,166 |
| 75 to 79 years | 87 | 7,935 | 297,519 | 7,317,795 |
| 80 to 84 years | 69 | 7,466 | 243,833 | 5,743,327 |
| 85 years and over | 40 | 7,370 | 230,429 | 5,493,433 |
| MEDIAN AGE BY SEX | ||||
| Both sexes Map | 48.50 | 42.90 | 38.80 | 37.20 |
| Male Map | 47.70 | 40.70 | 37.40 | 35.80 |
| Female Map | 49.70 | 45.00 | 40.00 | 38.50 |
| HOUSEHOLDS | ||||
| Total Households Map | 909 | 98,712 | 4,603,435 | 116,716,292 |
| HOUSEHOLDS, HOUSEHOLD TYPE | ||||
| Family households: Map | 664 | 62,676 | 2,991,629 | 77,538,296 |
| Husband-wife family Map | 532 | 43,140 | 2,173,477 | 56,510,377 |
| Other family: Map | 132 | 19,536 | 818,152 | 21,027,919 |
| Male householder, no wife present Map | 45 | 4,707 | 215,841 | 5,777,570 |
| Female householder, no husband present Map | 87 | 14,829 | 602,311 | 15,250,349 |
| Nonfamily households: Map | 245 | 36,036 | 1,611,806 | 39,177,996 |
| Householder living alone Map | 203 | 31,365 | 1,328,550 | 31,204,909 |
| Householder not living alone Map | 42 | 4,671 | 283,256 | 7,973,087 |
| HOUSEHOLDS, HISPANIC OR LATINO ORIGIN OF HOUSEHOLDER | ||||
| Not Hispanic or Latino householder: Map | 888 | 95,645 | 4,505,331 | 103,254,926 |
| Hispanic or Latino householder: Map | 21 | 3,067 | 98,104 | 13,461,366 |
| HOUSEHOLDS, RACE OF HOUSEHOLDER | ||||
| Householder who is White alone | 866 | 81,250 | 3,883,694 | 89,754,352 |
| Householder who is Black or African American alone | 28 | 14,668 | 554,094 | 14,129,983 |
| Householder who is American Indian and Alaska Native alone | 5 | 205 | 10,322 | 939,707 |
| Householder who is Asian alone | 0 | 528 | 64,713 | 4,632,164 |
| Householder who is Native Hawaiian and Other Pacific Islander alone | 0 | 18 | 1,214 | 143,932 |
| Householder who is Some Other Race alone | 4 | 1,016 | 36,315 | 4,916,427 |
| Householder who is Two or More Races | 6 | 1,027 | 53,083 | 2,199,727 |
| HOUSEHOLDS, HOUSEHOLD TYPE BY HOUSEHOLD SIZE | ||||
| Family households: Map | 664 | 62,676 | 2,991,629 | 77,538,296 |
| 2-person household Map | 330 | 29,294 | 1,335,123 | 31,882,616 |
| 3-person household Map | 148 | 14,715 | 689,256 | 17,765,829 |
| 4-person household Map | 118 | 11,048 | 562,136 | 15,214,075 |
| 5-person household Map | 45 | 4,954 | 257,799 | 7,411,997 |
| 6-person household Map | 16 | 1,742 | 94,221 | 3,026,278 |
| 7-or-more-person household Map | 7 | 923 | 53,094 | 2,237,501 |
| Nonfamily households: Map | 245 | 36,036 | 1,611,806 | 39,177,996 |
| 1-person household Map | 203 | 31,365 | 1,328,550 | 31,204,909 |
| 2-person household Map | 38 | 4,047 | 232,967 | 6,360,012 |
| 3-person household Map | 2 | 408 | 30,878 | 992,156 |
| 4-person household Map | 1 | 143 | 12,876 | 411,171 |
| 5-person household Map | 1 | 50 | 4,208 | 126,634 |
| 6-person household Map | 0 | 14 | 1,378 | 48,421 |
| 7-or-more-person household Map | 0 | 9 | 949 | 34,693 |
| HOUSING UNITS | ||||
| Total Housing Units Map | 1,014 | 111,833 | 5,127,508 | 131,704,730 |
| HOUSING UNITS, OCCUPANCY STATUS | ||||
| Occupied Map | 909 | 98,712 | 4,603,435 | 116,716,292 |
| Vacant Map | 105 | 13,121 | 524,073 | 14,988,438 |
| HOUSING UNITS, OCCUPIED, TENURE | ||||
| Owned with a mortgage or a loan Map | 514 | 43,356 | 2,176,481 | 52,979,430 |
| Owned free and clear Map | 318 | 26,336 | 934,573 | 23,006,644 |
| Renter occupied Map | 77 | 29,020 | 1,492,381 | 40,730,218 |
| HOUSING UNITS, VACANT, VACANCY STATUS | ||||
| For rent Map | 24 | 3,561 | 184,143 | 4,137,567 |
| Rented, not occupied Map | 0 | 171 | 8,126 | 206,825 |
| For sale only Map | 12 | 1,726 | 78,089 | 1,896,796 |
| Sold, not occupied Map | 1 | 414 | 19,263 | 421,032 |
| For seasonal, recreational, or occasional use Map | 4 | 779 | 58,591 | 4,649,298 |
| For migrant workers Map | 1 | 3 | 346 | 24,161 |
| Other vacant Map | 63 | 6,467 | 175,515 | 3,652,759 |
| HOUSING UNITS, OCCUPIED, AVERAGE HOUSEHOLD SIZE BY TENURE | ||||
| Total: Map | 2.47 | 2.34 | 2.44 | 2.58 |
| Owner occupied Map | 2.48 | 2.42 | 2.54 | 2.65 |
| Renter occupied Map | 2.36 | 2.15 | 2.24 | 2.44 |
| HOUSING UNITS, OCCUPIED, TENURE BY RACE OF HOUSEHOLDER | ||||
| Owner occupied: Map | 832 | 69,692 | 3,111,054 | 75,986,074 |
| Householder who is White alone Map | 792 | 61,993 | 2,819,180 | 63,446,275 |
| Householder who is Black or African American alone Map | 27 | 6,378 | 213,788 | 6,261,464 |
| Householder who is American Indian and Alaska Native alone Map | 5 | 111 | 5,284 | 509,588 |
| Householder who is Asian alone Map | 0 | 286 | 35,173 | 2,688,861 |
| Householder who is Native Hawaiian and Other Pacific Islander alone Map | 0 | 7 | 483 | 61,911 |
| Householder who is Some Other Race alone Map | 4 | 458 | 13,283 | 1,975,817 |
| Householder who is Two or More Races Map | 4 | 459 | 23,863 | 1,042,158 |
| Renter occupied: Map | 77 | 29,020 | 1,492,381 | 40,730,218 |
| Householder who is White alone Map | 74 | 19,257 | 1,064,514 | 26,308,077 |
| Householder who is Black or African American alone Map | 1 | 8,290 | 340,306 | 7,868,519 |
| Householder who is American Indian and Alaska Native alone Map | 0 | 94 | 5,038 | 430,119 |
| Householder who is Asian alone Map | 0 | 242 | 29,540 | 1,943,303 |
| Householder who is Native Hawaiian and Other Pacific Islander alone Map | 0 | 11 | 731 | 82,021 |
| Householder who is Some Other Race alone Map | 0 | 558 | 23,032 | 2,940,610 |
| Householder who is Two or More Races Map | 2 | 568 | 29,220 | 1,157,569 |
| HOUSING UNITS, OCCUPIED, TENURE BY HISPANIC OR LATINO ORIGIN OF HOUSEHOLDER | ||||
| Owner occupied: Map | 832 | 69,692 | 3,111,054 | 75,986,074 |
| Not Hispanic or Latino householder Map | 815 | 68,067 | 3,067,502 | 69,617,625 |
| Hispanic or Latino householder Map | 17 | 1,625 | 43,552 | 6,368,449 |
| Renter occupied: Map | 77 | 29,020 | 1,492,381 | 40,730,218 |
| Not Hispanic or Latino householder Map | 73 | 27,578 | 1,437,829 | 33,637,301 |
| Hispanic or Latino householder Map | 4 | 1,442 | 54,552 | 7,092,917 |
| HOUSING UNITS, OCCUPIED, TENURE BY HOUSEHOLD SIZE | ||||
| Owner occupied: Map | 832 | 69,692 | 3,111,054 | 75,986,074 |
| 1-person household Map | 177 | 18,256 | 712,604 | 16,453,569 |
| 2-person household Map | 342 | 26,304 | 1,181,472 | 27,618,605 |
| 3-person household Map | 141 | 11,081 | 502,915 | 12,517,563 |
| 4-person household Map | 110 | 8,645 | 427,146 | 10,998,793 |
| 5-person household Map | 44 | 3,644 | 187,245 | 5,057,765 |
| 6-person household Map | 12 | 1,206 | 65,128 | 1,965,796 |
| 7-or-more-person household Map | 6 | 556 | 34,544 | 1,373,983 |
| Renter occupied: Map | 77 | 29,020 | 1,492,381 | 40,730,218 |
| 1-person household Map | 26 | 13,109 | 615,946 | 14,751,340 |
| 2-person household Map | 26 | 7,037 | 386,618 | 10,624,023 |
| 3-person household Map | 9 | 4,042 | 217,219 | 6,240,422 |
| 4-person household Map | 9 | 2,546 | 147,866 | 4,626,453 |
| 5-person household Map | 2 | 1,360 | 74,762 | 2,480,866 |
| 6-person household Map | 4 | 550 | 30,471 | 1,108,903 |
| 7-or-more-person household Map | 1 | 376 | 19,499 | 898,211 |
Loading...